Animations and 3D models
Powerful and user friendly visualization for teachers, students and anyone with a keen interest in science. Just click and drag.
Earthquakes

historical earthquakes in Turkey
Map and timeline of the earthquakes in Turkey since 1905. To pick an interval: click and drag on the timeline.
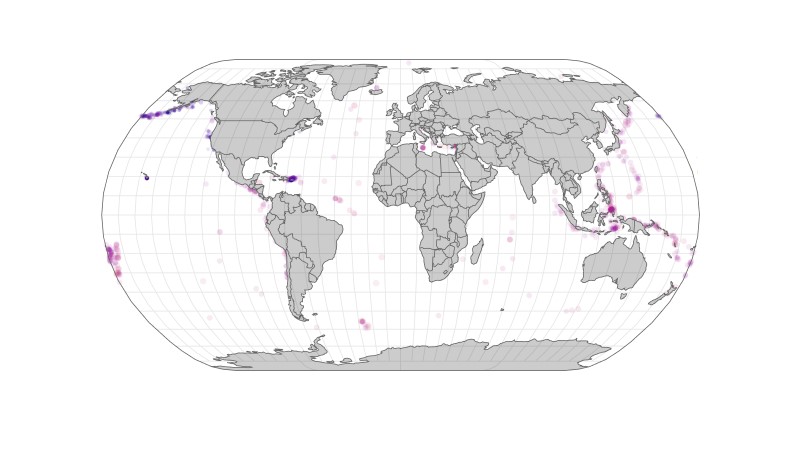
last month's earthquakes
Map and timeline of the earthquakes worldwide last month. To pick an interval: click and drag on the timeline.

earthquakes in South America
Draggable 3D-model depicting the depth of the hypocenter and thus de position of the subduction zone..
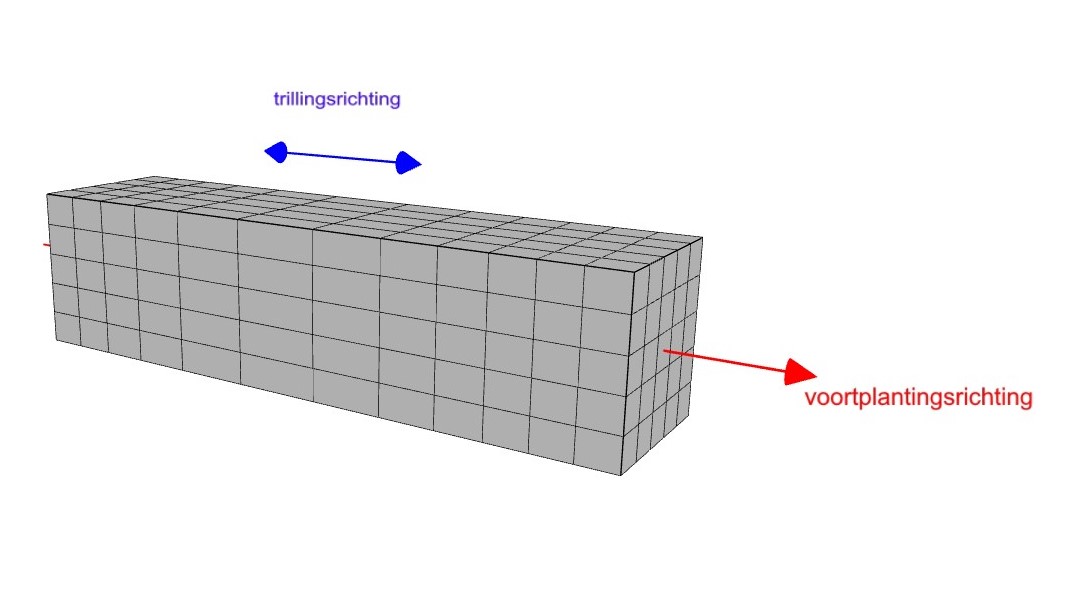
longitudinal wave
Draggable animation of a p-wave.
transverse wave
Draggable animation of a s-wave.
Astronomy
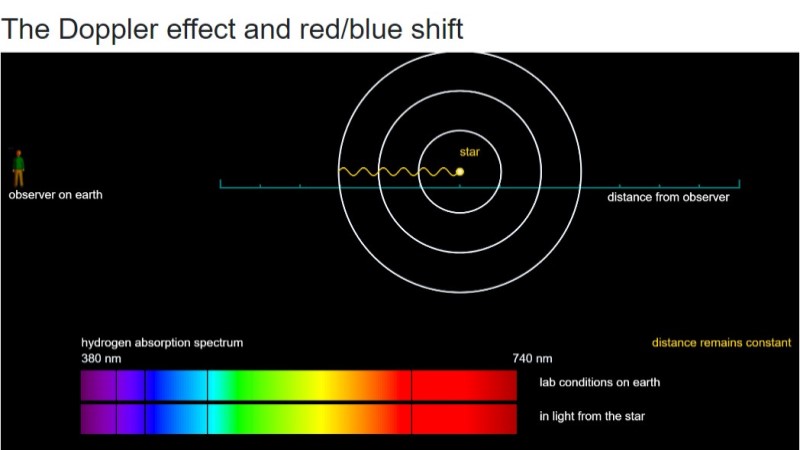
the Doppler effect
Animation showing the correlation between the change in position of a star and the changes in wavelength and spectrum.

Illumination of the earth
Interactive showing the seasons and the duration of day and night
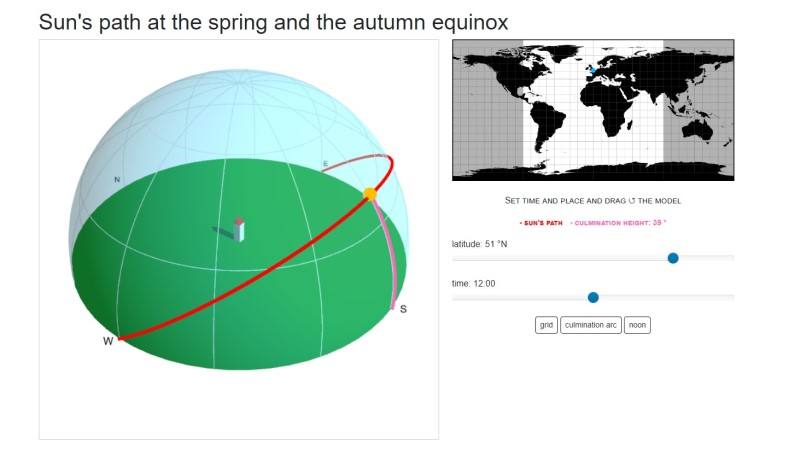
sun's path at the equinoxes
Set time and place and drag the model. The sun casts real shadows.

sun's path at the summer solstice
Set time and place and drag the model. Toggle sun's path at equinox on/off for comparison.
The structure of the earth

the structure of the earth
Draggable and annotated 3D model of the earth. Doubleclick on the map layer to make it transparent. Northern hemisphere.

isostatic rebound
Animation showing the effects of the formation of an ice cap on the lithosphere.
The atmosphere
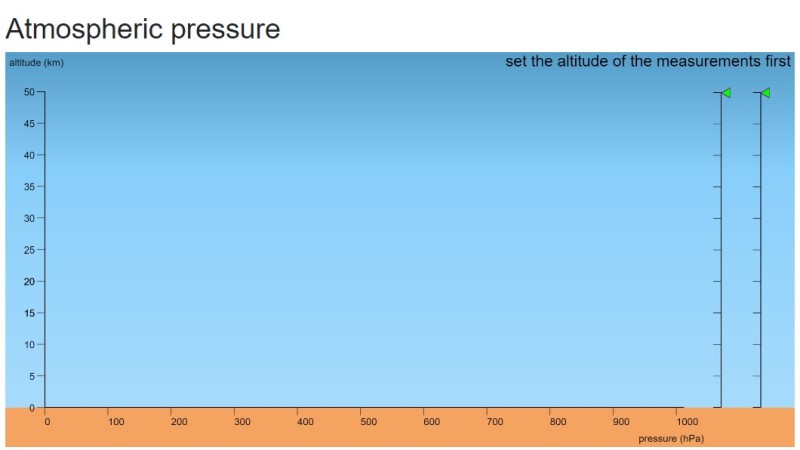
atmospheric pressure
Set altitudes and discover the correlation between altitude and pressure.
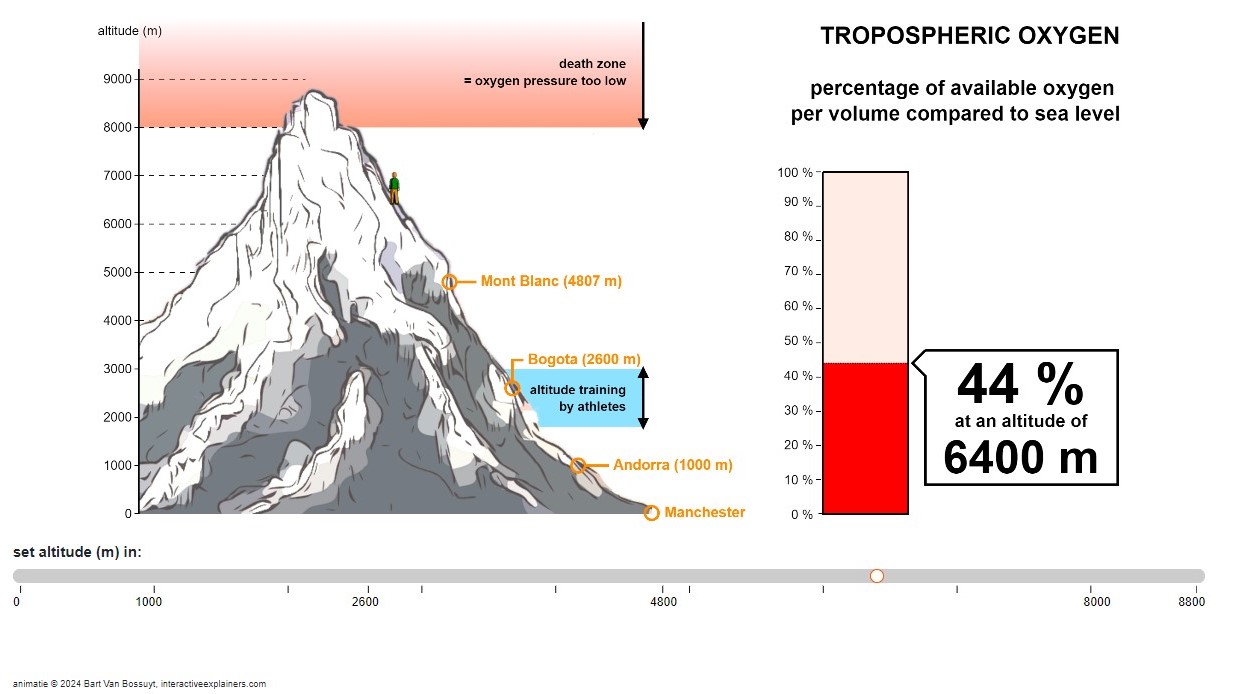
oxygen in the troposhere
Set the altitude and compare oxygen levels to those at sea level.
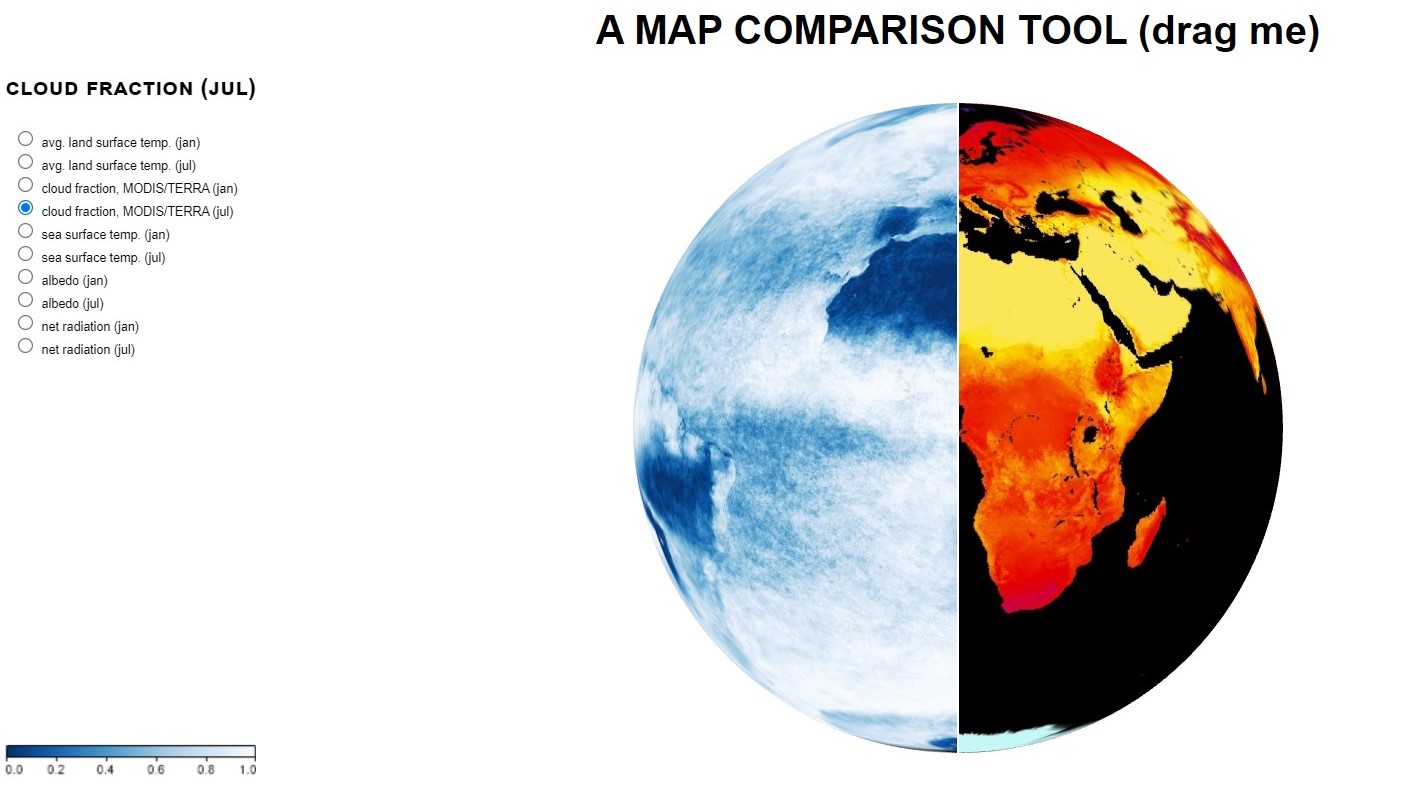
map comparison tool
Select a left and right hand side map, drag the globe and compare.
Weather

cold front
Animation showing the effect of the passage of a cold front on temperature and precipication.
Plate tectonics
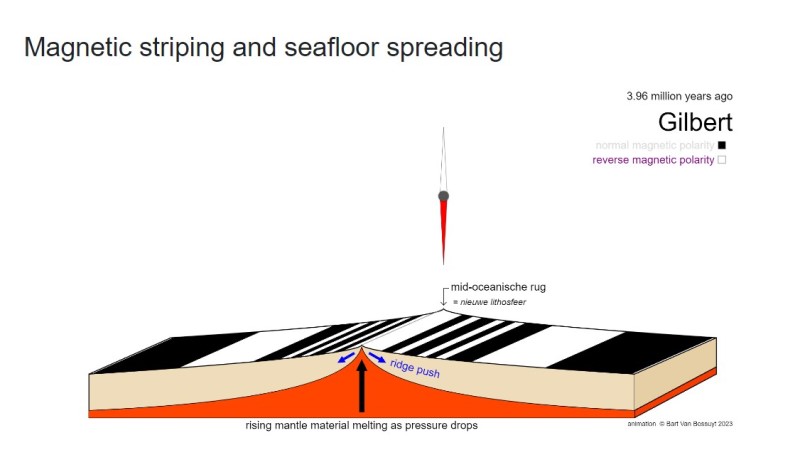
magnetic striping and seafloor spreading
Block diagram and interactive timeline showing magnetic reversals from the past 4 million years.
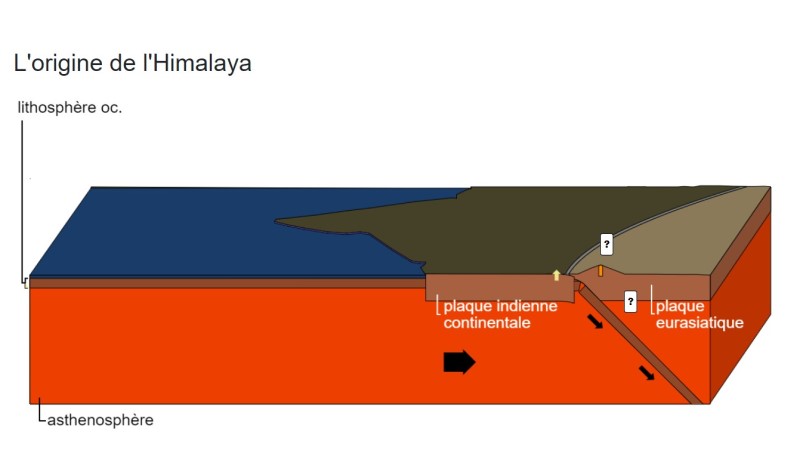
the origing of the Himalayas
Interactive block diagram showing the formation of the Himalayas and explaining the occurrence of ocean sediments at high altitudes.
sneak preview: crystal lattices (mineralogy, Dutch and in progress)